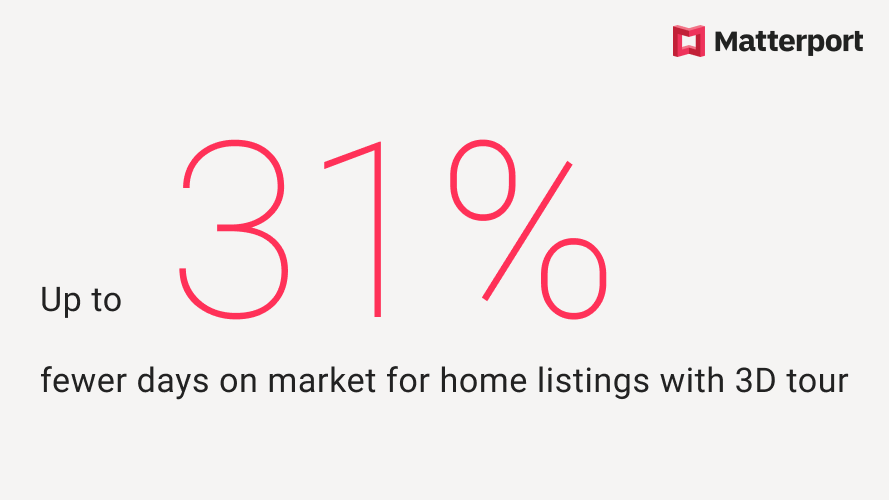
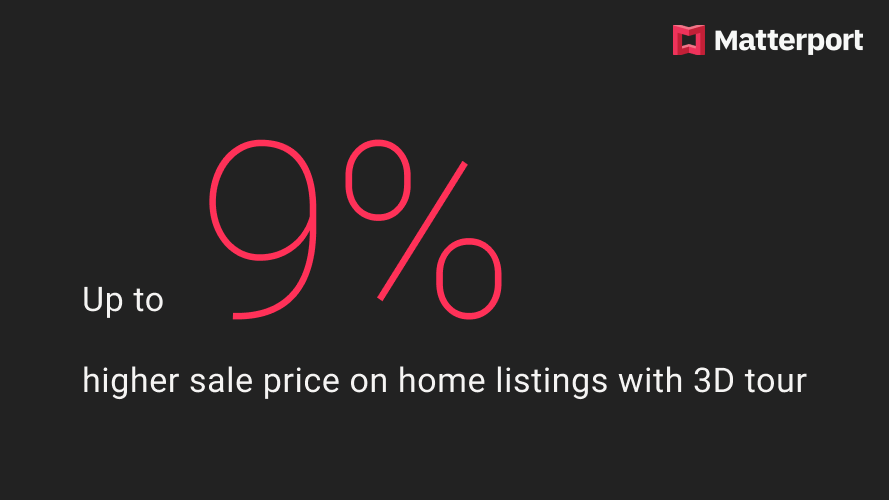
With 3D Tours, properties sell up to 31% faster and at a higher price
Results from two different researchers show that Matterport 3D virtual walkthroughs can have a measurable effect on real estate transactions.

For the past five years, agents and brokers worldwide have used the Matterport 3D virtual walkthrough to differentiate their real estate services and bring the concept of a 24/7 virtual open house into the mainstream. Now, preliminary results from two separate studies indicate that listings with a Matterport 3D virtual walkthrough sell for a higher price and can spend less time on market than homes listed using a traditional marketing package.

The first study used an academic statistical analysis of MLS (multiple listing service) transaction data from four markets across the United States in the South, Southwest, Northwest and Midwest. It showed that depending on the market, the average listing with a 3D virtual tour sold for up to nine percent higher and closed up to 31% faster. Over 90% of the listings with 3D tours used Matterport.
A second study analyzed one of the MLS datasets of the same metropolitan areas (South), but used more traditional comparative market techniques similar to how a real estate agent “looks for comps.” This study also showed that homes with a Matterport 3D digital twin sold 20% faster (fewer days on market) than properties that did not have a Matterport 3D virtual walkthrough.
A variety of factors go into how long a property stays on market and its sales price. Controlling for these other factors was a key part of both studies. Future research will continue investigating the sustained effect of 3D virtual walkthroughs.
These initial results show that 3D is fast becoming a necessary tool in real estate property marketing. Whether using rigorous statistical methods (first study) or an expert agent’s comparative analysis (second study), both methods showed a visible lift across similar homes in the same geographic market. For more details on how these studies were conducted, please read below.
“We saw our average days on market drop from 30 to 21 days and our average sales price to list price jump from 93 to 97% within a six month window.”
- Jay Acker, Real Estate by Design Group, Keller Williams Realty
First Study (Rigorous Statistical Analysis)
Key Results from Preliminary Analysis
On average, listings with 3D tours:
Closed at 4-9% higher sale price, depending on the market
Closed up to 31% faster (South market)
The results are stable over time in the two markets with larger data available
Data
Total: 143,575 listings, of which 3,935 had a 3D tour (over 90% were Matterport 3D tours)
Timeframe: November 2016 to November 2019 (each market differed in timeframe)
Source: Data obtained from MLS databases via extracts
Location: Four Markets (South, Southwest, Northwest and Midwest)
Methodology
Multiple regression analyses to test the impact on final sales price and days-on-market
Additional Variables: Existence of a video tour, number of photographs, number of bedrooms, number of bathrooms, age of home, number of dining rooms, square ft, number of fireplaces, acres, number of living rooms, the existence of a pool, commission rate, days on the market, final sales price.
Researcher
Kelley Anderson is a Ph.D. candidate studying Marketing at the Jerry S. Rawls College of Business Administration at Texas Tech University. Kelley has over 15 years experience in consumer insights across various companies, such as Golfsmith, Wal-Mart and Stage Stores. Her research focuses on how marketing using digitally mediated environments influences consumer behavior and the overall market.
K.T. Manis, Ph.D. is a researcher at the Jerry S. Rawls College of Business Administration at Texas Tech University. K.T. has 10 years experience in hospitality, marketing and event industries. His research broadly focuses on how the interplay between technology and strategy impacts a firm’s competitive advantage.
Second Study (Comparative Market Analysis)
Listings with a Matterport 3D tour:
Sold 20% faster (less days on market)
For 4.8% more (higher sale price)
Data
Total: 700 listings (350 with Matterport and 350 without)
Timeframe: March 2018 to July 2019 (16 months)
Source: MLS data obtained via third-party online portals
Location: Major metropolitan market in the Southern United States
Methodology
A list of 350 residential real estate properties, marketed with a Matterport 3D model, was compiled. For each listing, the following property features were identified: local neighborhood, zip code, property type (condo/co-op, single-family home, etc.), bedrooms, bathrooms, square footage, lot size and year built. In addition, the following business data was also collected for each listing: listing price, sale price, listing date, offer date and sale date.
A second list of 350 residential properties, marketed without a Matterport 3D model, was then compiled to be compared against the first group. Using a comparative market analysis (CMA) approach, i.e., expert opinion based on matching property criteria, neighborhood proximity and contemporaneous sales timeframe, similar properties marketed without Matterport were identified and paired with each of the 350 properties marketed with Matterport for comparison and analysis.
Finally, two key metrics were calculated: days-on-market (sale date minus listing date) and sale-to-list price ratio (selling price divided by the asking/listing price). These were calculated for each listing and then averaged across the first group as well as the second group. These averages were then compared to reveal any differences between how long a property took to sell and as to whether it sold for more or less than the asking price, if marketed with a Matterport 3D model.
Researcher
Sebastian Diessel is a real estate technology consultant with 20 years of experience across the Boston and San Francisco markets. Diessel was the founder and former co-owner of LoftsBoston.com, an industry-pioneering, real estate and broker marketing platform focused on the live/work loft market in Boston.
